WISPHero home

See your whole network at a glance, and know when something goes down.

WISPHero is a monitoring app for small wireless internet service providers (WISPs). It runs on your own server, checks the towers, radios and customer connections you add, and tells you in plain words what changed and why.

See what it does

An early release (version 1). You install it on your own Ubuntu server. How far each part is proven

See what is wrong

The Status page is the screen you leave open. Every device you add gets a card, problems sort to the top, and the page updates every 2 seconds.

One card per device

WISPHero pings each device itself. By default it checks a device every 30 seconds, a business customer every 60 seconds and a residential customer every 2 minutes, and you can change each of these. A device that is down or not in good shape is checked again every 15 seconds. Each check gives a quality from packet loss and reply time (latency), and the card takes that color.
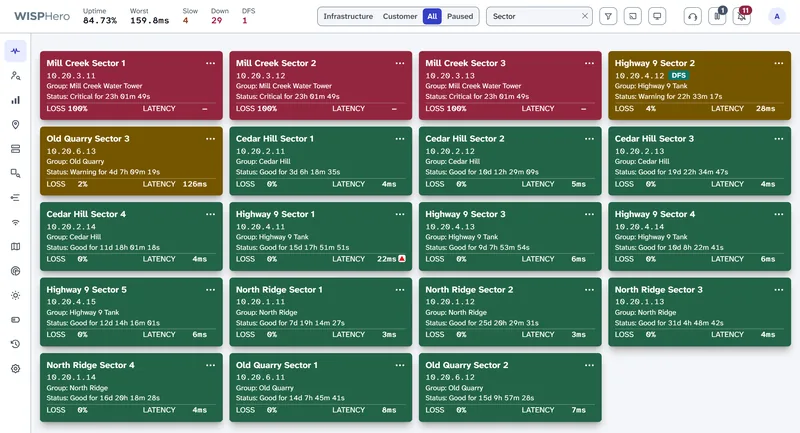
The Status page showing one card per access point. Three red cards for access points that are down, two amber cards for access points with packet loss or high latency (one marked DFS), and green cards for healthy ones. Each card shows the device name, address, site, how long it has been in its current state, and its loss and latency. One green card has a small red up-arrow next to its latency.
One card per device, problems first. The small red arrow on a green card means its latency has been rising.

What a card shows

Color
Green is good, amber is a warning, orange is bad, red is critical or down, and gray is not monitored. The color carries the state, so the front needs no extra words.
Name and address
The address links to the device's own web page.
Status line
How long the device has been in its current state, counted live, such as "Good for 5d 21h".
Loss and latency
Packet loss and reply time from the latest check. Jitter (how much the reply time varies) can be turned on.
Trend arrow
A small red up-arrow means a number is getting worse; a green down-arrow means it is getting better. It appears only after a steady change over several checks, so normal ups and downs do not set it off.
Tags
Up to two short tags, such as Note, DFS (a radar hit), AP Lockup, Grid Outage, Maintenance, Paused, or the customer class (Residential, Business or Tower Owner).

The limits: good is up to 5% loss and 100 ms; warning, up to 15% and 200 ms; bad, up to 30% and 300 ms; anything worse is critical. You can change them for each customer class or device. The issues WISPHero found and a 24-hour graph are on the back of the card: see card diagnostics.
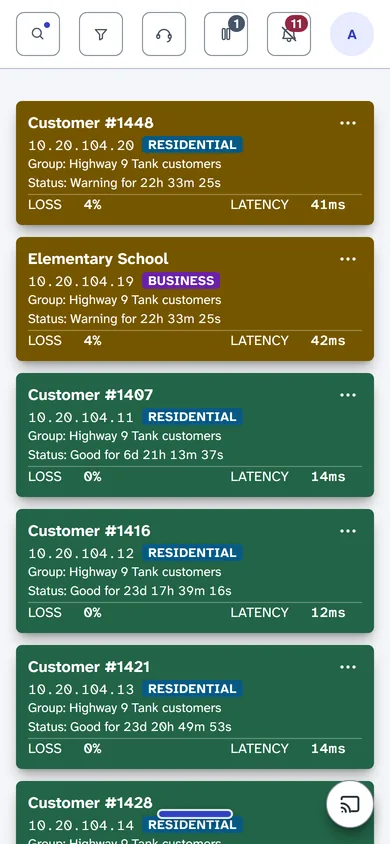
Individual Status cards on a phone: two amber customer cards with packet loss first, then green customer cards, each with its address, a Residential or Business tag, status time, loss and latency.
One card per device on a phone, worst first.

Grouped site cards

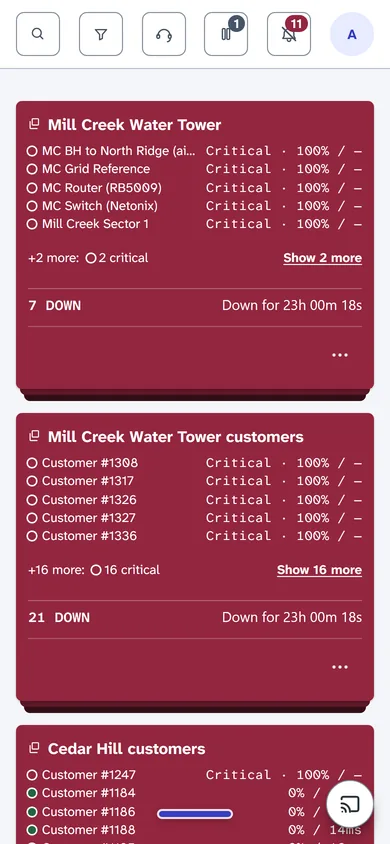
When a tower loses power, every device on it goes red at once. With one card per device, that one problem fills the screen with 28 red cards and pushes every other problem out of sight. Grouping folds a site's devices into one card, so one failing tower is one card.

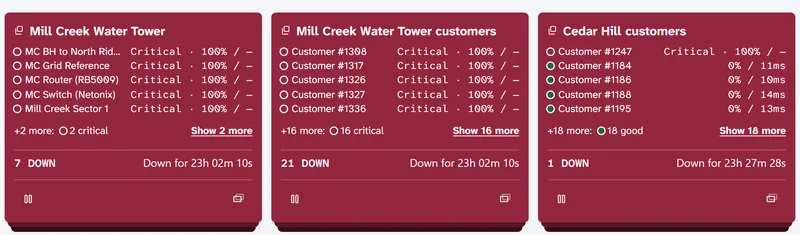
Three grouped site cards. The first, for a water tower site, lists five devices that are critical, then '+2 more: 2 critical' with a 'Show 2 more' link, and a footer reading '7 DOWN' and 'Down for 47m'. The second groups 21 down customers. The third groups a customer site where one customer is down and the rest are good.
Three grouped site cards: devices listed worst first, then a count of what is down and for how long.

How a grouped card works

  1. The card takes the color of its worst device, so a site with one device down is still red.
  2. It lists five devices, worst first. Among devices in the same state, down devices come first, then backhaul links, then the rest by name.
  3. A line such as "+2 more: 2 critical" sums up the rest. "Show 2 more" opens them inside the card.
  4. The footer counts what is down, such as "7 DOWN", and says how long it has been since the first device dropped, such as "Down for 47m".

Grouped or one card each: you choose

"Group by site" is a setting for each person. Manual, the default, shows one card per device, and you can still group one busy site from its card's menu. Automatic groups every site with two or more devices on screen. The Ungroup button on a grouped card brings back the single cards, and List view always shows one row per device. To see one device's diagnostics, ungroup its site and turn its card over.

Paused for planned work

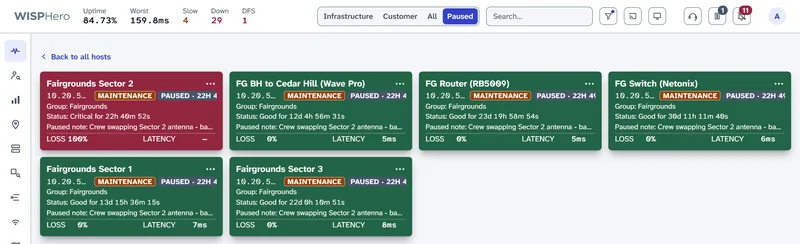
Pause a device or a whole site, and add a note if you like. While it is paused, it sends no down or outage alerts, and it moves to its own Paused tab. The other views hide it and the "down" count leaves it out, so planned work does not look like an outage. Each card shows the pause note and how long it has been paused.

The Paused tab of the Status page with six cards from one tower under planned maintenance. Each card has a Maintenance tag, a Paused tag with how long it has been paused, and the pause note. One card is red because that radio is down during the work.
Six devices at one tower during planned work. One radio shows red because it is down while the crew works on it.

The day in a few sentences

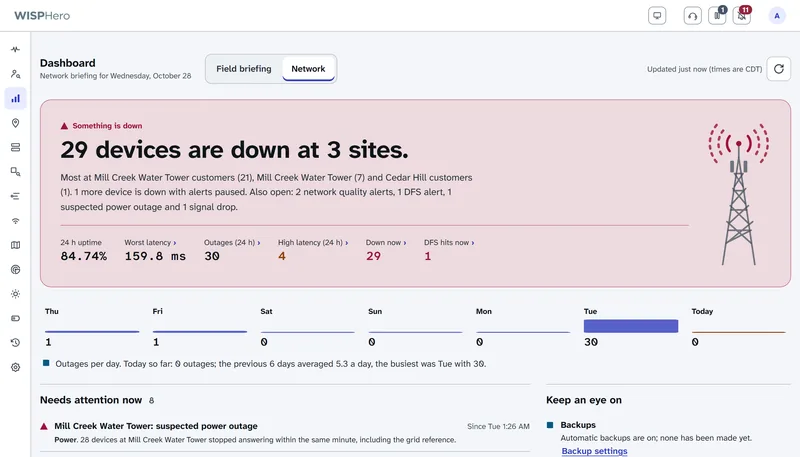
The dashboard's network view sums up the last 24 hours in short sentences: what went down, for how long, and what still needs attention. The sentences follow fixed rules, not guesswork. When something was not checked, it says "not checked".

The default view is a field briefing: today's weather from the US National Weather Service (MET Norway outside the US) and a "can we climb today?" answer based on the wind limits you set.

The dashboard's Network view. One sentence says 29 devices are down at 3 sites, followed by counts for uptime, latency, outages, slow devices, down devices and radar hits, outages per day for the last week, and a list of what needs attention now.
The Network view: a plain-language summary of the last 24 hours and what needs attention now.

Find the cause

A red card tells you something is wrong. These tools show why, and since when.

Open any card

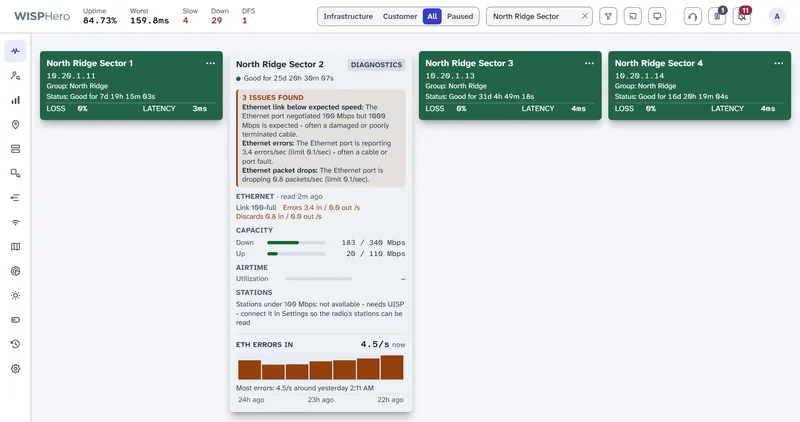
Double-click a card (double-tap on a phone) and it turns over. The back lists the issues WISPHero found, in plain sentences, then the readings behind them.

Most of the back comes from readings WISPHero has already stored, so it opens fast even during a large outage. A few parts, such as airtime and the router panel, ask the device when you open the card. The back refreshes every 15 seconds. Cards that turn critical can flip over by themselves, so the reason is already showing when you look up. Each person can turn that off.

A row of four access point cards on the Status page. One card is flipped over to its diagnostics side, listing three issues found with its Ethernet port, the port's speed, errors and discards, capacity use, and a graph of Ethernet errors over 24 hours.
Double-click a card to turn it over. The other cards stay as they are.

What the back of a card checks

Each part appears only when there is real data for it. Nothing is filled in with a guess.

Issues found
A plain list of what is wrong now or in the last 48 hours, or "No issues detected". It follows fixed rules.
Signal
The radio's signal and noise level in dBm (decibels relative to a milliwatt; closer to zero is stronger): green at -75 or better, amber from -76 to -78, red at -79 or worse.
Ethernet
The link speed, errors and dropped packets per second, and cable quality. A link slower than you expect is listed under Issues found.
LAN ports
Each local network (LAN) port on the customer radio: up or down, and at what speed.
Fiber
The light level received and sent. The received level turns amber, then red, as it nears the edge of the usable range.
Capacity
Download and upload traffic against what the link can carry: amber at 70%, red at 90%.
Airtime
How busy the access point's channel is. It warns above 50%.
Stations
How many of the access point's customer radios connect at less than 100 Mbps.
Radar (DFS) hit
When the access point heard radar, and how many customer radios it had before and has now.
AP lockup
When an access point (AP) stopped serving customers but still answered ping, and how many it served before.
Router
The customer's MikroTik router: software version, Wi-Fi networks, connected devices and ports.
Grid outage
A utility power outage reported near the device.
Device
Live readings you picked for that device over SNMP (Simple Network Management Protocol, the standard way to read a device's counters).
24-hour graph
The most useful reading for that device, with outages as red bands and the worst moment named.

Signal, LAN ports, airtime and stations come from UISP, Ubiquiti's network manager. Ethernet error counts come from the radio over SNMP, fiber light levels from a Calix E7 fiber system over SNMP, and the router panel from MikroTik or Admiral Platform. The demo has no UISP, so its airtime shows a dash and Stations says it needs UISP. That is what you will see without UISP.

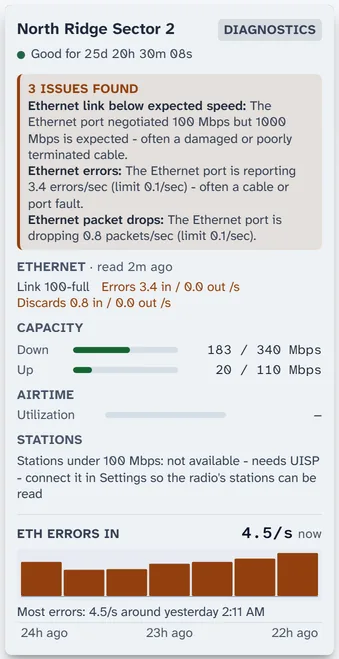
  • The back of an access point's Status card. Three issues found: the Ethernet link negotiated 100 Mbps where 1000 is expected, 3.4 errors per second, and 0.8 dropped packets per second. Below are the Ethernet readings, capacity meters, airtime, a note that the station count needs UISP, and a 24-hour bar graph where Ethernet errors start in the last few hours.
    Access point with a bad cable: the link fell to 100 Mbps and errors started a few hours ago.
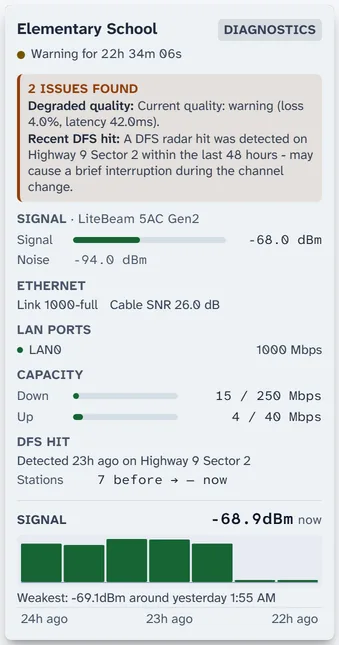
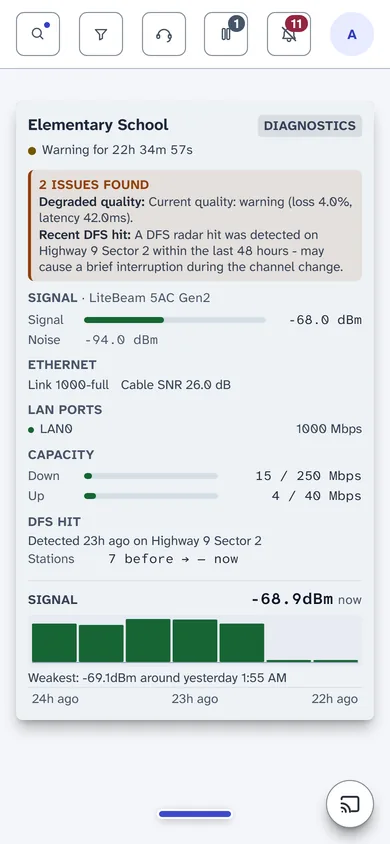
  • The back of a customer radio's Status card. Two issues found: degraded quality and a recent DFS radar hit on its access point. Below are the signal and noise readings, Ethernet link and cable SNR, the LAN port, capacity use, the DFS hit with the station count before it, and a 24-hour signal graph.
    Customer radio after its access point heard radar: signal, Ethernet, LAN port, capacity and the radar hit.
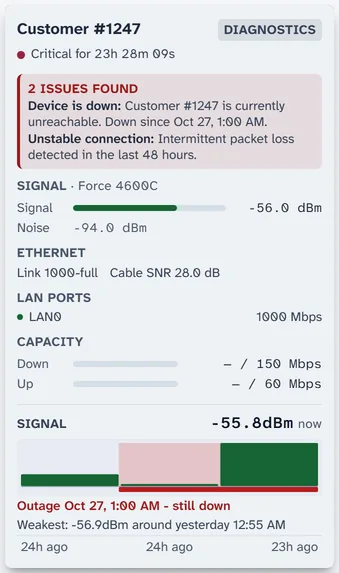
  • The back of a down customer's Status card. Two issues found: the device is down and since when, and intermittent packet loss in the last 48 hours. Below are the last signal reading, Ethernet and LAN port, capacity, and a 24-hour signal graph with a red band marking the outage that is still going on.
    Customer radio that is down: since when, what came before, and the outage as a red band.
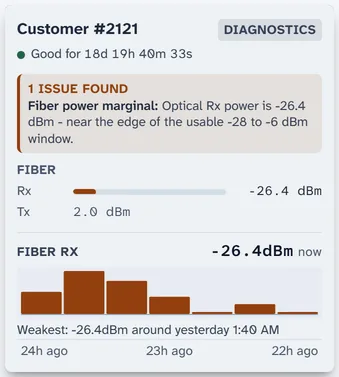
  • The back of a fiber customer's Status card. One issue found: optical receive power of -26.4 dBm is near the edge of the usable range. Below are receive and transmit power and a 24-hour graph where the receive power slowly weakens and turns from green to amber.
    Fiber customer whose light level is slowly fading toward the edge of the usable range.
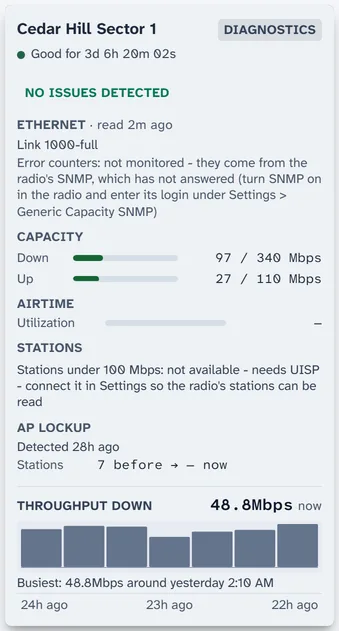
  • The back of an access point's Status card with no current issues. It shows Ethernet, capacity, airtime and stations sections, an AP lockup section saying one was detected 6 hours ago with 7 stations before, and a 24-hour throughput graph.
    Access point that locked up 6 hours ago, with the number of customer radios it served before.
Five cards, turned over. They are shown a little larger than on screen so the text is easy to read.

Compare devices side by side

Is it the access point or the customer? Compare puts up to ten devices on the same charts over the same time range. If an access point and its customers slow down together, look at the access point or its backhaul. If one customer drops alone, look at that customer.

How it works

  1. Open History and choose Compare.
  2. Search for devices by name and add up to ten. A live table shows each one's loss, latency and jitter right now.
  3. Pick a time range: 24 hours, 7 days, 30 days, 90 days or your own dates.
  4. Every chart draws one line per device: latency, loss, jitter, uptime, signal, Ethernet errors and speed, fiber light level, traffic, and outages.
  5. Each comparison has its own link, so you can send it to a colleague.
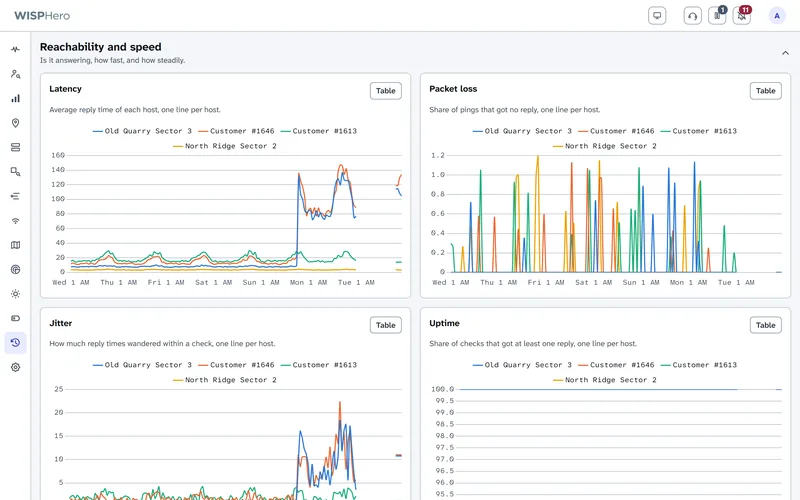
History in Compare mode with four devices over seven days: a latency chart where an access point and one of its customers jump from about 10 ms to over 120 ms on the last day while the other two stay low, and a packet loss chart, one line per device.
An access point and one of its customers slow down together on the last day; the other two devices stay low.
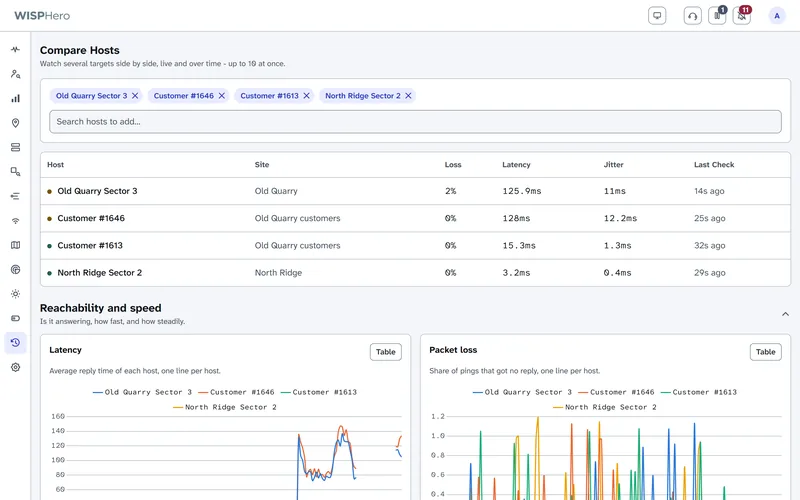
The top of History Compare: four selected devices shown as removable chips, a search box to add more, and a live table with each device's site, loss, latency, jitter and last check.
Pick up to ten devices. Their live numbers show above the charts.
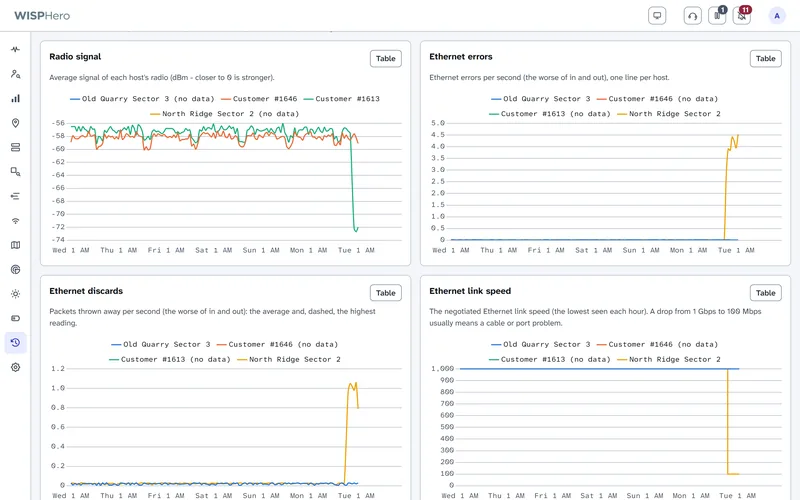
More Compare charts for the same four devices: radio signal, where one customer's signal falls from about -57 to -73 dBm at the end of the week; Ethernet errors and discards, where one access point jumps on the last day; and Ethernet link speed, where that access point drops from 1000 to 100 Mbps.
Signal and Ethernet charts show which device changed, and when.

Compare works on devices. It does not compare whole sites with each other, or one week with another.

History you can graph

Compare is one view of the History page. The other views show about 20 charts of reply time, loss, uptime, outages, signal, Ethernet, traffic and radar hits for one device, one site or the whole network, from the last 24 hours to the last 90 days. Every chart has a Table button with the exact numbers, so you can see, for example, whether a radio gets worse at the same time every evening.

Radios and channels

Some 5 GHz channels are shared with weather radar. When a radio hears radar on one, the rules make it leave that channel for 30 minutes. This is called DFS (dynamic frequency selection), and one radar hit can drop every customer on an access point at once.

Radar (DFS) hits and fallback channels

  1. Every 5 minutes, WISPHero reads the device list from UISP. It marks a 5 GHz Ubiquiti airMAX access point as hit when it has left the DFS channel it was set to, or when UISP reports a radar lockout. Mimosa point-to-multipoint radios are checked over SNMP.
  2. While a hit is active, WISPHero also rereads the radios that were hit every 60 seconds.
  3. Each hit shows the fallback channel the radio moved to, checked against the radio's list of allowed frequencies in UISP.
  4. The FCC (the US Federal Communications Commission) keeps a radio off that channel for 30 minutes. During that time the Reboot button becomes a countdown, such as "FCC lockout: 12 min left", and the server blocks every way to reboot the radio.
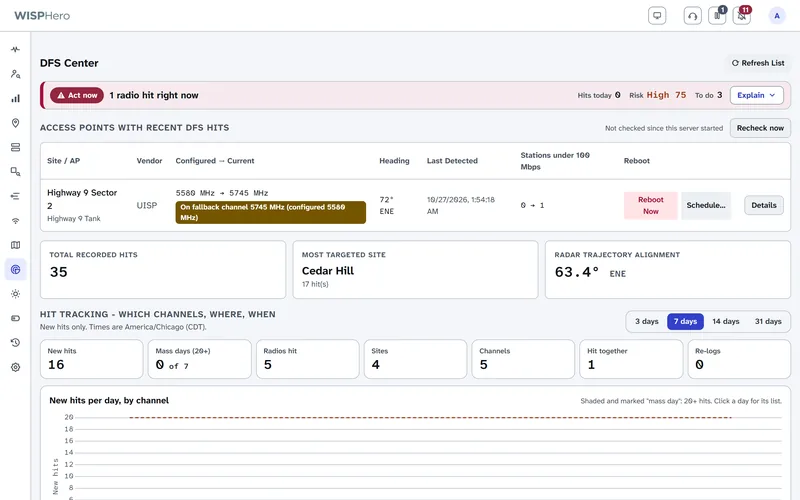
The DFS Center showing one access point that heard radar and moved from its configured channel to its fallback channel, with the time left before it can return.
An access point that heard radar, the fallback channel it moved to, and the time left in the FCC lockout.

After the lockout you can reboot the radio through UISP, now or at a set time. That needs a UISP key that allows changes; a read-only key can only watch. Automatic reboots are off unless you turn them on. Radios that WISPHero does not read through UISP or Mimosa SNMP are not checked for radar hits yet.

Why radar keeps hitting

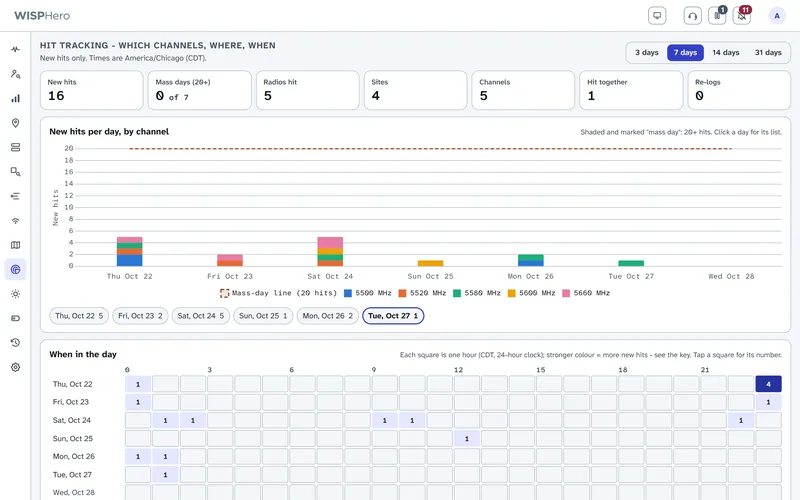
Hit tracking shows which channels hear radar, at which sites, and at what time of day, over the last 3 to 31 days. When three or more radios are hit within 15 minutes, the Burst Investigator groups them into one episode, with a timeline and what to check next.

"How worried should I be?" runs 17 rule-based checks, such as lightning, heavy rain, aircraft, distance to an airport weather radar (TDWR), and whether hits come at the same time each day. Each check shows its reason. A check that could not run says "Not checked", never "Low".

DFS hit tracking for the last seven days: counts of new hits, radios, sites and channels, a bar chart of hits per day split by channel, and a grid showing which hours of the day the hits happened.
Which channels hear radar, at which sites, and at what time of day.

Frequencies and channels: what it does, and what it does not

WISPHero keeps a record of each radio's band, center frequency, compass heading and beamwidth. From this radio frequency (RF) record it finds radios that get in each other's way, and it checks that the record itself makes sense.

RF Defrag
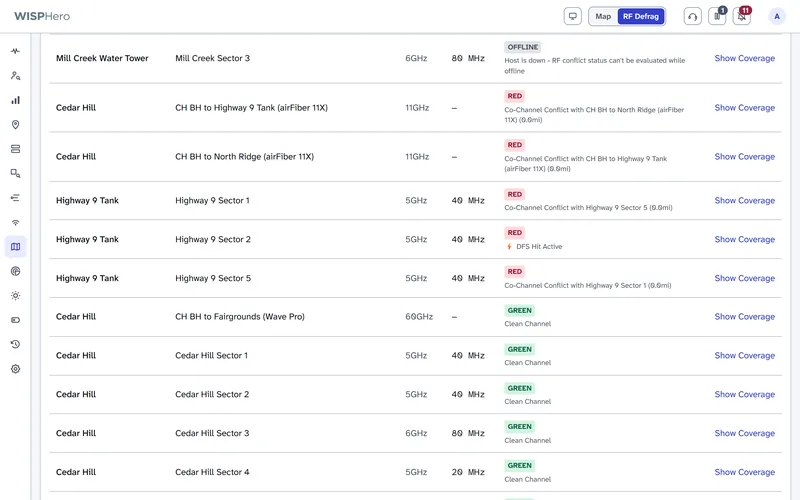
Checks every pair of radios within 5 miles of each other. It marks two radios red when they use the same channel and face each other or share a site, and yellow when they face each other or share a site and are within 20 MHz. Two radios that are both GPS-synced are shown as planned reuse, not as a conflict. You can change the distance and the gap in Settings.
RF data check
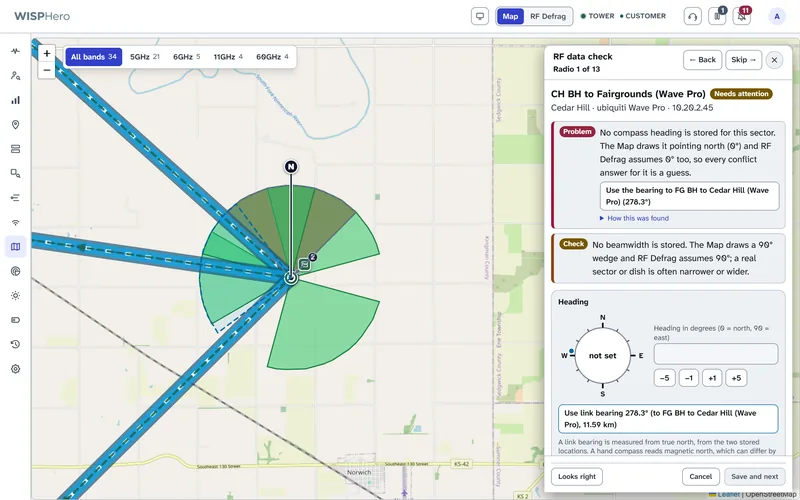
A wrong heading or frequency makes every answer wrong. The data check goes through your radios one at a time, worst first, and looks for missing or doubtful headings, bands that do not match the frequency, locations far from their site, and radios that are not GPS-locked. It suggests a fix, such as "Use link bearing 278.3°", and changes nothing until you save.
Live channel tracking
With UISP connected, WISPHero follows each access point's live frequency and records every channel change. When a customer's signal drops because of a channel move or a radar hit, it says so instead of blaming storm damage.
The RF Defrag list. Each row shows a site, a radio, its band, channel width and a status: red rows report a co-channel conflict with another radio at the same site, or an active DFS hit; green rows say Clean Channel; offline rows say the radio is down and cannot be judged.
RF Defrag: red rows share a channel with a radio they face or a radio at the same site.
The RF data check open beside the map. It is on radio 1 of 13 and says no compass heading is stored for this backhaul, offers the bearing of its link as a suggestion, and notes that no beamwidth is stored. The map shows that tower's sector wedges and links.
The data check walks through radios with a missing or doubtful heading, band, frequency or location. Map data © OpenStreetMap contributors.

Radar, interference and weather: why a radio dropped

When an access point goes quiet, the first question is why. WISPHero checks the usual suspects for you, from a radar hit to a storm to a long-distance signal bending in the air, and shows the evidence for and against each one. Every check is rule-based, shows its reason, and says "Not checked" when it could not run, never a guessed "Low".

Airport weather radar (TDWR) overlap
Terminal Doppler Weather Radars sit near big airports and share the 5.6 GHz band with your radios. WISPHero lists the 47 FAA radar sites (from the FCC and WISPA list) and flags any antenna that is within 35 km of one and whose channel is within 30 MHz of the radar's frequency. Both limits are the FCC defaults and you can change them in Settings. A radio whose channel is farther off than that cannot be hearing that radar, and WISPHero says so.
Is that radar even on?
For the nearest weather radars it shows live status from a community outage tracker (not an official source), so a radar that is switched off is not blamed for a hit.
Radio ducting
Under some weather conditions the air bends radio signals far past their normal range, so a distant source can land on your channel. WISPHero draws a ducting forecast map from NOAA's global weather model and uses it as one of its checks.
Storms and lightning
Lightning strikes near a hit (NOAA GOES satellite), heavy rain (NOAA weather radar) and weather alerts (National Weather Service). After a storm, the after-storm check compares each device's signal, Ethernet, fiber and voltage before and after.
Aircraft and space weather
Aircraft near your towers (OpenSky) and solar and space weather (NOAA SWPC) are checked too, so they can be ruled in or out.
Seven ranked explanations
Examples are the radio's own false detection, a fixed TDWR, a local source, ducting and storms. Each of the seven shows the evidence for and against it and the cheapest check to run next.
Bursts and the source area
When three or more radios are hit within 15 minutes, the Burst Investigator groups them into one episode. From which radios heard radar and which did not, it also estimates a rough area where a local source could be, labelled "geometry only, not a position fix".
Why a customer's signal dropped
When a customer's signal drops, WISPHero looks for a radar hit, a channel change or a restart on their access point first, and says which one it found.

Grid outages: is the power out?

When a whole site goes quiet, the cause is often the power company and not your equipment. WISPHero reads public utility outage feeds and tells you when an outage is reported near a tower, so you can tell a dead grid from a dead radio before you send anyone out.

Where the reports come from
Several public outage feeds: Kubra StormCenter (32 utilities are preset), ODIN from the US Department of Energy and Oak Ridge National Laboratory (more than 150 utilities), ArcGIS outage maps that some utilities publish, a NIPSCO feed, and electric co-op maps hosted on outagemap.coop. The default Automatic mode picks the feeds for where your towers are.
How fresh it is
The feeds are checked every 5 minutes.
Where you see it
A Grid Outage tag on the Status card of an affected device, a layer and an entry in the issues panel on the network map, and an alert.
A suspected outage, even with no feed
If your utility publishes no outage map, WISPHero can still notice. When a site's chosen power reference device stops answering ping, it raises a suspected power outage alert.
In diagnostics
Card diagnostics and the Customer Diagnostic list power outages nearby next to the weather and the radar hits. When the cause is a power outage, the Customer Diagnostic does not offer a chance of fixing it by phone, because no one can fix it from a call.

Remote sites

Some sites cannot be reached from your network operations center (NOC): a business customer behind its own router, or a tower behind carrier-grade NAT, the address sharing that blocks incoming connections. A remote agent watches those sites from the inside.

Remote agents

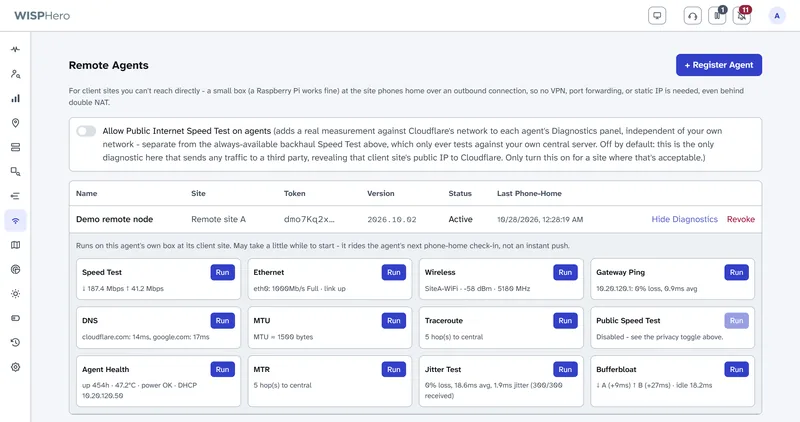
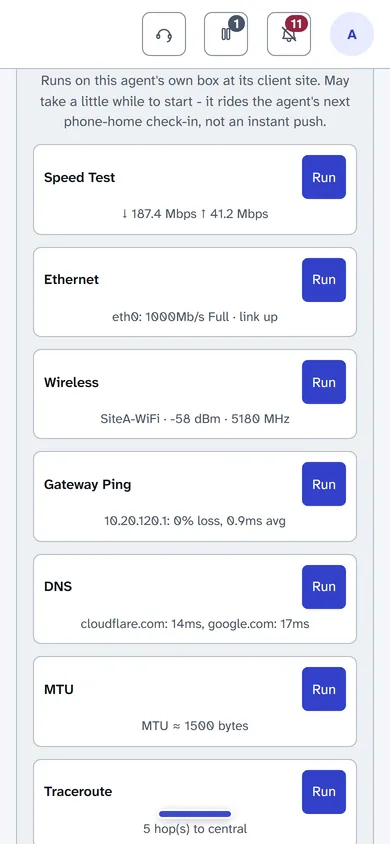
A remote agent is a small computer at the site that watches the devices there and runs network tests when you ask. It reports to your WISPHero server, so the site shows up like any other.

The Remote Agents page with one agent, 'Demo remote node', for a remote site. Its Diagnostics panel shows the latest result of each test: speed test, Ethernet, Wi-Fi, gateway ping, DNS, MTU, traceroute, agent health, MTR, jitter and bufferbloat. The public internet speed test is turned off.
A remote agent at a customer site, with the latest result of each test and a Run button.
What it is
The same WISPHero software, started in agent mode, with its own small database.
Where it runs
On a small Linux computer at the site, such as a Raspberry Pi, in Docker.
How it connects
Outbound only. About every 45 seconds it calls your WISPHero server over HTTPS, sends its results and picks up any tests you have asked for. You need no VPN (private tunnel), port forward or fixed IP address. If the link drops, it keeps its results and sends them when the link is back.
What you see
The site's devices appear on your Status page and raise alerts like any others.
How you manage it
On the Agents page, an admin registers the agent and gets a one-time token. You run the installer on the box with that token. The installer shows your server's certificate and asks you to accept it; from then on the agent trusts only that server. You can revoke an agent at any time. Each site has one agent.

Tests you can run from the office

Each test shows its latest result and a Run button. A test rides the agent's next check-in, so it starts within about a minute.

  • A speed test to your own server
  • Ethernet: link speed, duplex and errors
  • Wi-Fi: network name, signal, frequency and nearby networks
  • Gateway ping, and DNS (name lookup)
  • Path MTU: the largest packet that gets through
  • Traceroute, and MTR: loss and delay at each hop
  • A long jitter test
  • Bufferbloat: delay under load, graded A+ to F
  • The box's own health, including Raspberry Pi power warnings

A public internet speed test (Cloudflare, with M-Lab as a backup) is there too, but it is off by default because it is the only test that sends traffic to an outside service. The box also shows its own status page on the site's local network, which works even when the link to your server is down.

Proven so far: the check-in and the test round trip have run between two copies of WISPHero on one computer. The agent has not yet run on a real Raspberry Pi or through a real NAT, and its Linux test tools have not yet run on real hardware.

Remote agent diagnostics on a phone: speed test, Ethernet, wireless, gateway ping, DNS and MTU results, each with a Run button.
Run tests at a remote site.

Your network on a map

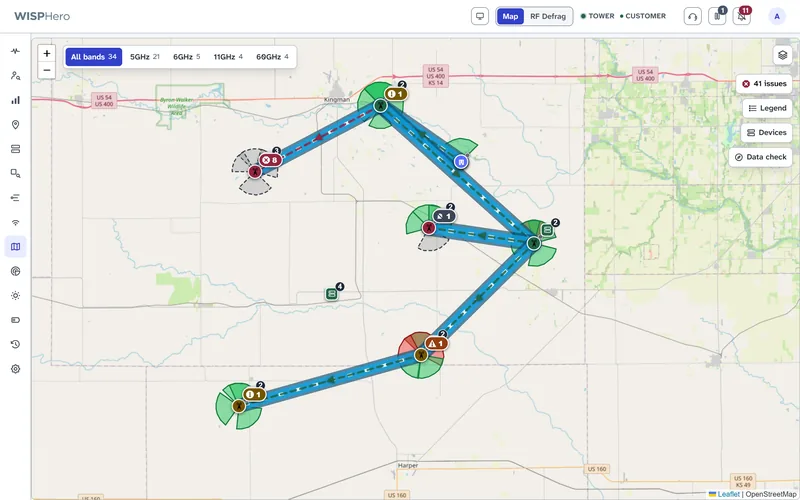
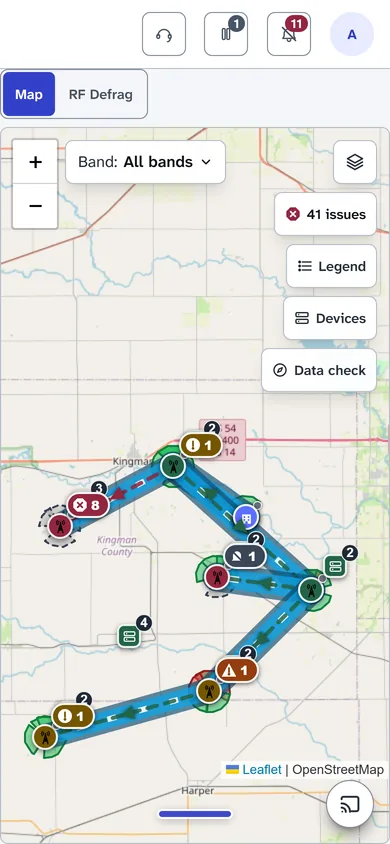
Towers with their sector wedges, backhaul links colored by the live health of their worse end, customers and fiber, on one map. An issues panel lists down devices, radar hits, power outages and ports that are down. Layers add weather radar and lightning from NOAA (the US weather and ocean agency), utility power outages, flights and airport weather radar sites.

Plan coverage over real terrain: the heat map and link profiles account for distance, the biggest obstacle in the path and the clear space a radio beam needs. It is a quick planning model, not a full radio study. You can also draw fiber routes, poles and splice enclosures.

A map of six towers joined by backhaul links, with colored sector wedges and small badges marking sites that have problems.
Towers, sectors and backhaul links on a live map. Map data © OpenStreetMap contributors.

Alerts and customers

Tell the right people once per problem, and answer customers while they are still on the phone.

Alerts that say what happened

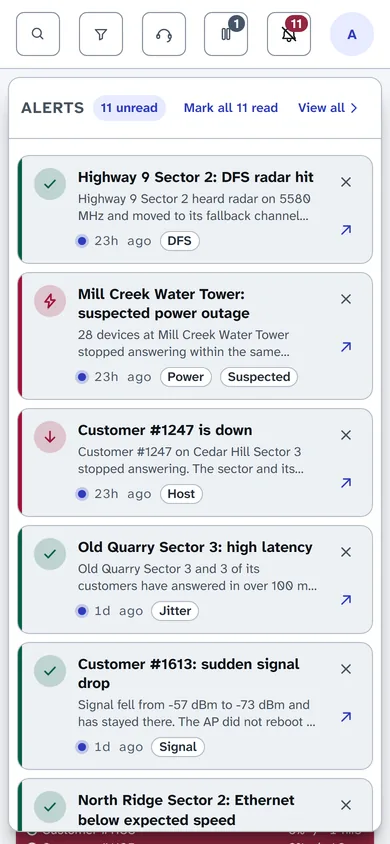
When three or more devices at one site are down, you get one site alert, updated as things change, instead of one alert per device. At five or more, it is titled "Suspected Outage". Other alerts cover radar hits, sudden signal drops (10 decibels or more below the device's own normal, for at least 30 minutes), access point lockups, power outages nearby and battery maintenance.

Alerts reach you as push notifications in your browser or on your phone, or by email through your own mail server. Each person chooses which alerts reach them, and how. A paused device or site sends no down or outage alerts.

The alerts list open on a phone, showing a radar hit, a tower power outage, a customer that is down, high latency and a signal drop.
The alerts list on a phone.

Customer Diagnostic

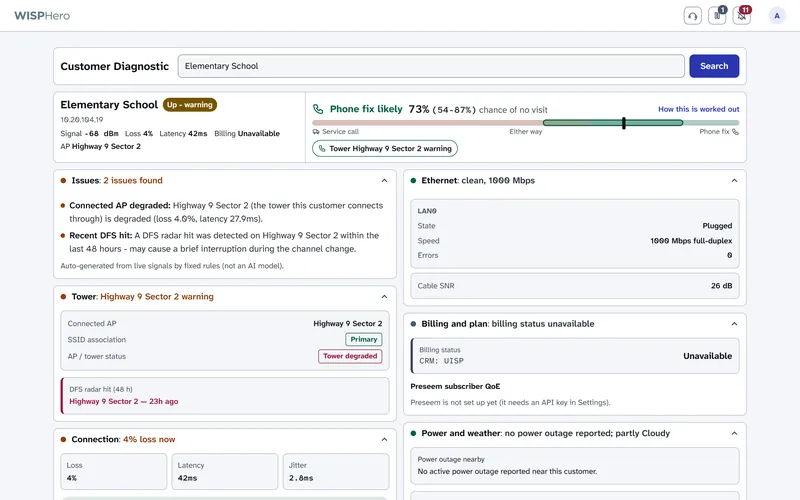
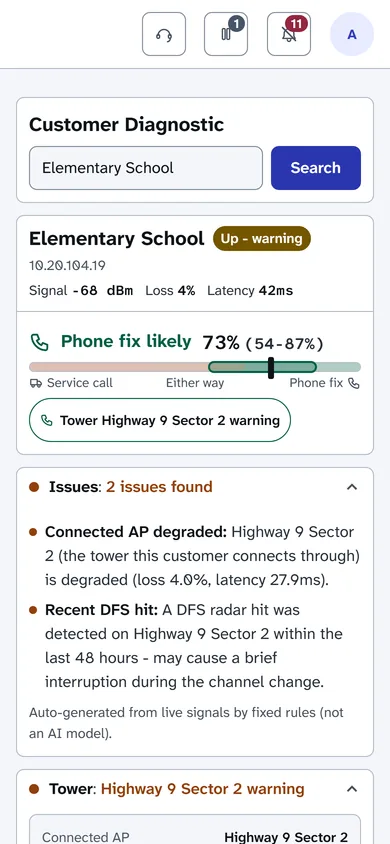
Search for a customer by name, IP address or MAC address, and get one page a support person can read out on the phone: whether the customer's radio answers, its signal, their access point and its health, recent outages, radar hits, power outages and weather nearby, and billing status from Sonar. The strongest evidence comes first.

It also estimates whether the problem can be fixed over the phone, as a percentage with a range and the reasons. It starts from published figures for broadband in general and blends in your own results once 30 similar calls are logged. It gives no percentage when the cause clearly needs something else, such as a tower that is down. Call-center staff can use it without access to settings.

Customer Diagnostic for one customer: the connection status, signal, the access point it uses, an estimate that the problem will likely clear on its own, and two issues found, described in plain words.
What is wrong with a customer's connection, in plain words.

A status page for your customers

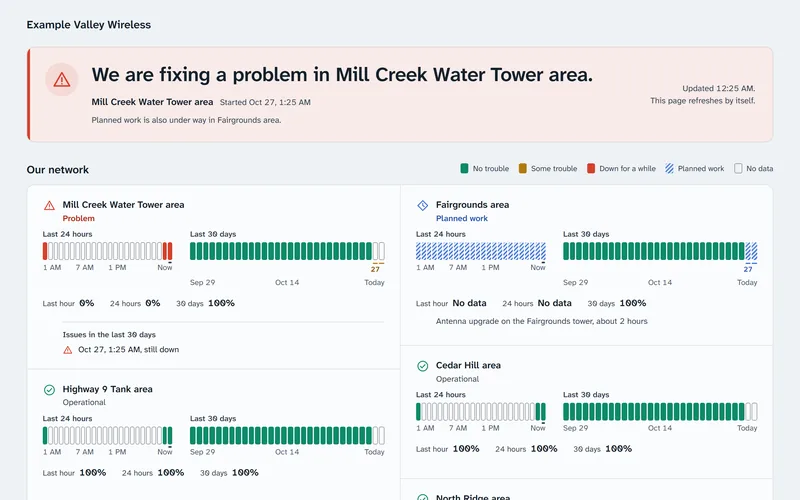
Turn on a public page that tells customers whether their area has a known problem, which saves calls. It shows your company name, logo and accent color, with no WISPHero branding. Planned work from your maintenance pauses shows too, and you can place the page inside your own website.

The page is off until you turn it on.

A public status page for a made-up wireless internet provider, with a banner about a problem in one area, a note about planned work in another, and uptime bars for each area.
A public status page your customers can check themselves.

Find where a path breaks

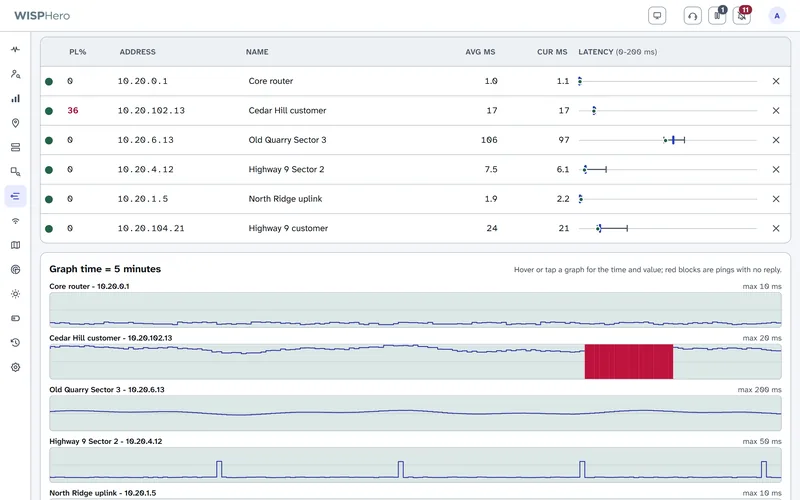
The Ping Tool pings up to 50 addresses side by side, as often as once a second. Each address gets its own graph on one shared timeline, so you can see where along a path the trouble starts.

A missed reply shows as a solid red block, never as zero. Copy the results or save them as a CSV file for a spreadsheet. It stops by itself after 30 minutes.

The Ping Tool pinging six devices side by side, with packet loss, average and current reply times for each, and a graph for each device below. One graph shows a red block where replies stopped.
Ping several devices at once and see where loss starts.

The same app on a phone

Much of the work happens away from a desk. Every page has a phone layout with buttons big enough for a thumb, and you can add WISPHero to your home screen like an app. The app mode does not save your pages or data on the phone.

Your server, your data

  • Runs on your own server

    Install it on an Ubuntu server or virtual machine, version 24.04 or newer. One installer sets up Docker, the app and its PostgreSQL database. The installer is new and is being tested now, so start on a spare server.

  • Your data stays on your server

    Device and customer data are stored on your server, not ours. The server contacts the systems you connect and public data sources, such as US weather, lightning and radar data, power-outage maps, flight data, satellite orbits and terrain data. While the dashboard's field briefing is open, it also reads public news and security feeds. Your browser loads map tiles from OpenStreetMap, weather radar images from NOAA, and some page code and fonts from public content networks. Settings > System > Network activity lists what the server sends, and many of these can be turned off.

  • Backups on a schedule

    WISPHero backs up its settings every day at 4 a.m. by default and keeps the last 7. Full backups are optional. A password can lock a backup, and the backup then carries what a new server needs to read your stored passwords. Keep a copy somewhere other than the server.

  • Signed updates you can undo

    To update, you upload an update file in Settings. WISPHero checks its signature before it unpacks anything and makes a backup first. Most updates can be undone for 14 days. An update that makes a database change that cannot be reversed cannot be rolled back from the page. If a new version fails to start three times, WISPHero goes back to the old one by itself.

  • Roles for your team

    There are three roles: super admin, admin and viewer, checked by the server on every request. A viewer, such as a call-center agent, sees only the sites and pages you give them, like Customer Diagnostic. Two-step sign-in with an authenticator app is optional, and you can require it for administrators. Each person gets recovery codes, and a super admin can reset a lost phone. It was checked against the standard test codes, not yet with a real phone app.

  • Mail through your own server

    Alert and password-reset emails go out through your own mail server or Gmail, and Settings has a "Send test email" button. Microsoft 365 is not supported yet.

Everything else it does

  • Header counters: 24-hour uptime, worst latency, and counts of slow devices, down devices and radar hits. The slow count opens a list of those devices.
  • Outages (24h): every outage of the day, ongoing ones first, with start time and length.
  • Filters you can share: every Status filter is kept in the page address, so a filtered view can be bookmarked or sent.
  • A "Reconnecting" banner: if the page loses contact with the server, it says so, so a frozen screen never looks like a healthy network.
  • Two kinds of notes: a private note on a card, or a call-center note that alerts the team.
  • List view: a dense table of every device instead of cards.
  • Wall displays and TVs: display windows with their own filters, and TV pairing with a one-time code. Casting from Chrome or Edge needs your own Cast app ID and HTTPS.
  • Devices: tables of access points, customer radios, SNMP devices and routers, each with OK or its number of open issues. The customer radio table shows when a radio has moved to its backup Wi-Fi network.
  • SNMP cards: build a card from any reading, import the vendor's MIB file (the file that names a device's readings), or start from ready-made profiles for common backhaul, LTE (4G cellular) and power gear.
  • Batteries: a register of tower battery banks with age, share of expected life used, estimated runtime and maintenance due. A bank with an unknown install date shows no age.
  • After-storm check: after a storm (heavy-rain or tornado alerts, or a raised lightning risk), it compares each device's signal, Ethernet, fiber and voltage before and after.
  • Utility outage feeds: power outages reported near your towers, on the card, on the map and in alerts.
  • Radar source estimate: from which radios heard radar and which did not, a rough area where a local source could be, marked "geometry only".
  • Radar context: lightning, aircraft, radio ducting and space weather on the DFS page.
  • Capacity sheet: click a link on the map to see each end's capacity and Ethernet speed, with your own overrides.
  • Traffic on the map: links shaded calm, busy or full, from readings WISPHero already collects.
  • Netonix switches: port traffic, errors, PoE (power over Ethernet) power, temperature, and saved settings with changes highlighted.
  • MikroTik routers: CPU, memory, routing neighbors and interface graphs, plus a customer router panel.
  • Preseem: whether a customer is using their whole plan, in Customer Diagnostic.
  • Sonar: import customers, sites and devices, and see billing status.
  • UISP CRM: read-only customer sync (name, address, plan, speeds, and the customer radio's address from the devices UISP already lists), on a schedule or on demand. It was built from UISP's published API and has not yet been tried on a real UISP CRM.
  • Solar sizing calculator: panels, batteries and tilt from NASA sun data, with every assumption shown.
  • Network discovery: a paced sweep of the private address ranges you list. It runs when someone opens the Discovery tab (you can turn that off), when someone starts a scan, or on a schedule you set. It never scans public addresses.
  • Gentle polling: one limit for all device polling, longer waits for failing devices, and a quiet mode that halves polling.
  • Find a setting: one search across every Settings tab.
  • No default passwords: setup starts with a one-time code, then you create the first account.

Netonix, MikroTik and Preseem are built from each vendor's documentation and have not yet been tried on real equipment or accounts. Sonar has been tried on a real account. See below.

How far each part is proven

WISPHero is an early version 1 release. It was built and tested on one development computer, against a made-up demo network and test copies of the systems it connects to. For monitoring, a read-only API key (an access key that cannot change anything) is enough; only rebooting a radio needs a key that allows changes.

Run against real public data
US weather alerts and forecasts (National Weather Service), lightning (NOAA GOES satellite), weather radar (NOAA MRMS), radio ducting forecasts (NOAA GFS), utility power-outage maps, the outage status of airport weather radars, and the remote agent's public speed test. Discovery's address-table read and ping sweep have run on a real office network.
Ubiquiti UISP
Built from UISP's published API and from what we learned testing a real UISP with a companion tool. WISPHero's own UISP connection has not yet run against a real UISP; that first run on a live network is next. Everything that reads UISP depends on it: radar hits, signal, LAN ports, stations, access point lockups and backup Wi-Fi changes.
Sonar
Tried against a real Sonar account with a read-only key: the import of sites and devices, the customer accounts and the photos all worked. On that account, only about one customer in five had a usable IP address in Sonar.
Built from vendor documentation
Cambium cnMaestro and Cambium SNMP, UISP CRM customer sync, Mimosa SNMP, Calix E7 fiber readings, Netonix switches, MikroTik RouterOS 7, Admiral Platform, Preseem, the ready-made SNMP profiles and solar charge controllers. Each was tested against sample data or a test copy of the service, not yet against real equipment or a real account.
Shown on demo data
The Status page and grouping, card diagnostics, History and Compare, the Ping Tool, RF Defrag and the data check, the map, Devices, Batteries, alerts and email, the public status page, TV displays, backups, updates, roles and the phone layout. Push notifications and the phone layout have not yet been checked on a real phone.
The installer
The installer and its Docker setup have not yet been run on a real server. That testing is happening now.
Not in this release
Channel planning, channel changes and spectrum analysis; Microsoft 365 mail; and customer sync from billing systems other than Sonar and UISP CRM. PowerCode, Splynx and Azotel can be used only for the plan check in Customer Diagnostic.